
Discover why business owners should track invoices and expenses monthly through Dext, QuickBooks or CSV, and how tools like Business Dashboard Pro turn them into a real-time profit & loss dashboard to manage your company proactively.
Running a Business Without a Dashboard Is Like Flying Blind
Many entrepreneurs only discover their company’s financial results a year after the end of their fiscal year — when their accountant finally delivers the annual report. By then, it’s too late to react. Expenses have been spent, margins have shrunk, and strategic decisions have been made in the dark.
Running a business without real-time financial visibility is like driving at night with no headlights — you might still move forward, but you can’t see the road ahead.
The Starting Point: The Invoices You Already Send to Your Accountant
Every month, you send your sales and purchase invoices to your accountant — usually through Dext, QuickBooks, or as a CSV export. But these documents are far more than accounting paperwork: they’re the raw material for your monthly profit and loss forecast.

By using that data proactively, you can monitor in real time:
- your revenue (excl. VAT),
- your purchases and direct costs,
- your operating expenses (rent, software, bank fees, etc.),
- and your net profit for the month.
Categorizing Is Understanding
The key to financial clarity is to assign each invoice to the right cost category — or, in accounting terms, to the proper expense account. This simple act turns a pile of invoices into a structured view of your business model.
- A rent invoice goes under occupancy costs.
- A software subscription under IT expenses.
- A delivery or packaging invoice under variable costs.
Once categorized, you can instantly see where your money goes and how efficiently your company operates.
Understanding the Key Profit & Loss Indicators
A monthly P&L statement is not just a list of numbers — it’s the story of your business in motion.
Here are the key financial indicators and management ratios every entrepreneur should understand:
- Gross Margin: revenue minus cost of goods sold. ➜ Measures the direct profitability of your sales.
- Contribution Margin (or margin on variable costs): revenue minus all variable expenses. ➜ Indicates how much your activity contributes to covering fixed costs.
- EBITDA (Earnings Before Interest, Taxes, Depreciation, and Amortization): your operating result before non-cash items. ➜ The most reliable measure of operational performance.
- Operating Profit: includes amortizations and provisions. ➜ Reflects your true operational efficiency.
- Net Profit: after financial and exceptional charges. ➜ The ultimate indicator of whether your business creates or destroys value.

The Power of Financial Ratios
Ratios make your financial data comparable and actionable. They allow you to identify trends, strengths, and weak points at a glance:
- Gross Margin (% of revenue) – ideally stable or growing; shows cost control and pricing power.
- Occupancy Rate (% of revenue) – indicates how heavy your rent and facility costs are.
- Payroll Ratio (% of revenue) – measures labor efficiency.
- Break-even Point – the theoretical sales level where your revenue covers all fixed and variable costs.

Knowing whether you’re above or below your break-even point gives you instant insight into your profitability.
From Raw Data to Smart Decisions
Most business owners don’t have the time (or desire) to build spreadsheets manually every month.
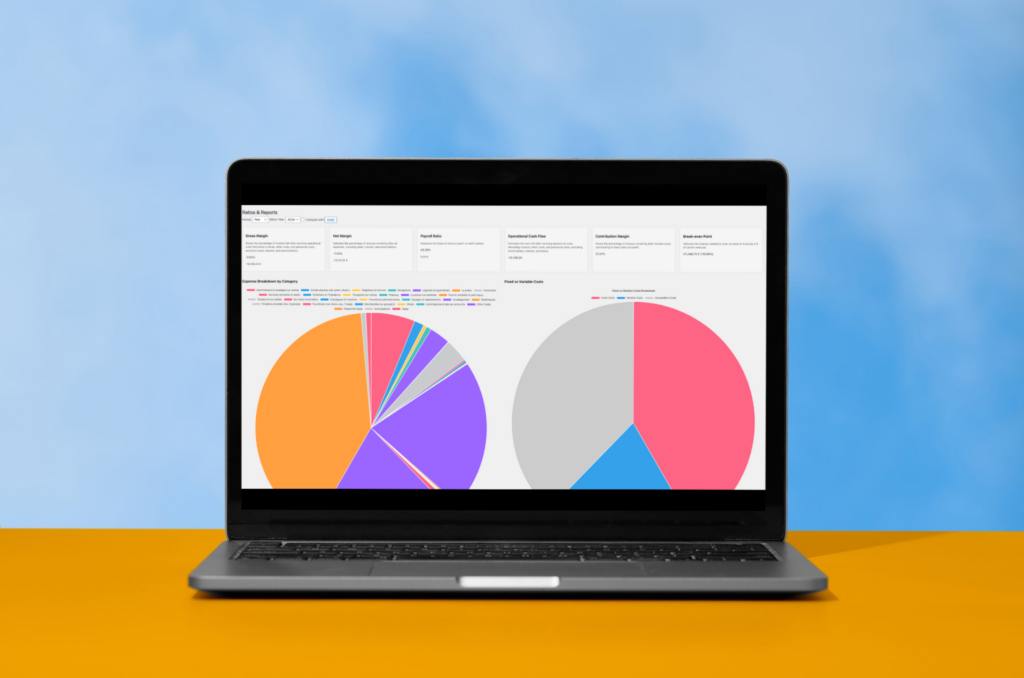
That’s why tools like Business Dashboard Pro connect directly to Dext, QuickBooks, or your CSV files to automatically generate your financial dashboard — complete with margins, ratios, and monthly P&L.

In just a few clicks, you can see:
- whether your margins align with your goals,
- whether your expenses are creeping up,
- and whether you’ve reached your break-even point.
It’s the easiest way to stay in control of your business performance — without waiting a full year for your accountant’s report.
In Conclusion
Financial monitoring isn’t just about accounting — it’s about anticipation and awareness.
With reliable and structured data, every entrepreneur can make faster, smarter, and more confident decisions.
Each invoice you send to your accountant can become a source of financial intelligence — if you have the right tool to transform it into insight.
That’s exactly what Business Dashboard Pro was built for: turning your accounting data into a real-time, living financial dashboard, so you can run your business with clarity and confidence.